The Mindset Shift: Why “How Much?” is the Wrong First Question
Before we can talk about numbers, we need to talk about philosophy. The most successful retailers have a fundamentally different way of thinking about their inventory. They’ve learned to stop asking “How much?” and start asking better, smarter questions.
Moving Beyond “Quantity” to “Quality” and “Velocity”
Obsessing over the total dollar value of your inventory is an old-school, and ultimately flawed, way of thinking. It’s like judging a car by its price tag instead of its performance. A modern, successful retailer obsesses over the *performance* of their inventory. They ask three smarter questions:
- How FAST does it move? (Velocity)
- How PROFITABLE is it? (Margin)
- How quickly can I REPLACE it? (Lead Time)
The answers to these three questions are infinitely more valuable than knowing the total value of the boxes in your backroom.
The Old Way vs. The New Way of Thinking About Inventory
This represents a fundamental shift in mindset, from seeing inventory as a static cost to seeing it as a dynamic investment.
| Factor | The Old Way (“Static Asset”) | The New Way (“Flowing River”) |
|---|---|---|
| View of Inventory | A necessary cost of doing business. | A dynamic investment that must generate a return. |
| Primary Goal | Have enough stock to avoid a stockout. | Keep stock moving as quickly as possible. |
| Key Metric | Total dollar value of inventory. | Inventory Turnover Rate and GMROI. |
| Supplier Relationship | Transactional (Just a vendor). | A Partnership (A key part of the system). |
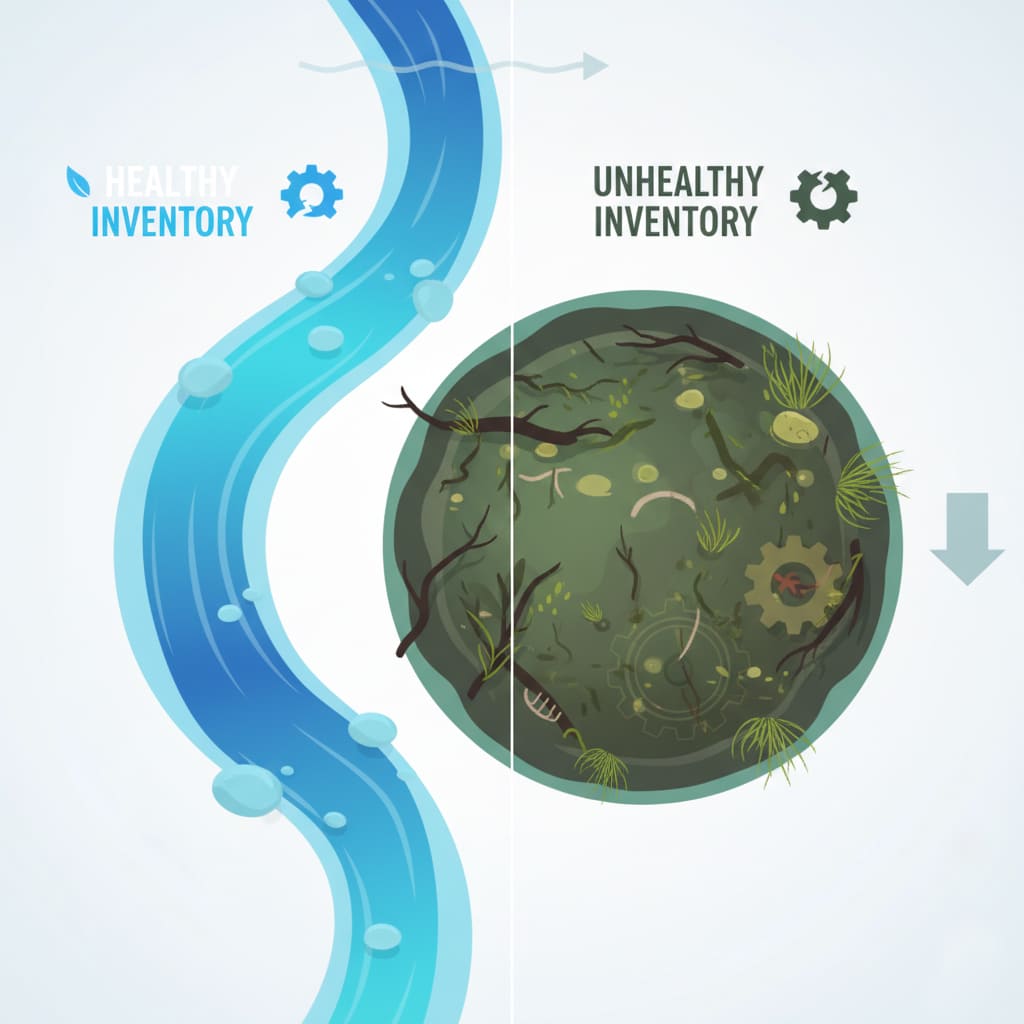
“Your inventory should be a flowing river, not a stagnant pond.”
This is the most powerful analogy for modern inventory management. A healthy inventory is a river, constantly being refreshed with new, exciting products (the source) and flowing out to happy customers (the destination). A stagnant pond just sits there. The water gets stale, algae (dead stock) starts to grow, and eventually, the whole system becomes unhealthy.
Your Inventory Dashboard: The 3 Key Metrics You Must Track
To keep your river flowing, you need a dashboard. You need simple, clear metrics that give you an honest, data-driven view of your inventory’s health. These three key performance indicators (KPIs) are your essential tools.
Metric #1: Inventory Turnover Rate – The Ultimate Vital Sign
This is the single most important number for understanding your inventory’s efficiency. In simple terms, it tells you **how many times per year you sell and replace your entire inventory**. A higher number is almost always better. It means your capital isn’t sitting idle; it’s constantly working for you.
The formula is simple: Cost of Goods Sold (COGS) / Average Inventory = Inventory Turnover Rate. If your total COGS for the year was $200,000 and your average inventory on hand was $50,000, your turnover rate is 4.0. You “flipped” your inventory four times. A low rate (below 2.0) is a major red flag that you’re carrying too much stock, the wrong stock, or both. A low turnover rate is often a direct symptom of a dead stock problem. Learn how to diagnose and cure that specific issue in our complete guide to reducing dead stock.
Metric #2: Sell-Through Rate – Your Monthly Performance Snapshot
While turnover gives you the big picture, the sell-through rate gives you a specific, granular snapshot. It tells you **what percentage of a product’s stock you’ve sold within a specific period** (usually a month). The formula is: Units Sold / (Beginning Inventory + Units Received) x 100.
This metric is incredibly useful for:
- Evaluating New Products: Did that new pendant light you brought in have a 70% sell-through in its first month? That’s a winner.
- Assessing Promotions: Did your weekend sale increase a product’s sell-through rate from 10% to 50%? The promotion worked.
It allows you to make quick, data-driven decisions on a SKU-by-SKU basis.
Metric #3: Gross Margin Return on Investment (GMROI) – The “Moneyball” Metric
This is the advanced metric that the most sophisticated retailers use. It answers the most important question of all: **”For every dollar I invest in inventory, how many dollars in gross profit am I getting back?”**
The formula is: Gross Profit / Average Inventory Cost = GMROI. A GMROI of 3.5 means you generated $3.50 in gross profit for every $1.00 you had invested in inventory. This metric is powerful because it combines both profitability (margin) and velocity (turnover). A low-margin item that sells incredibly fast can often be a better overall investment than a high-margin item that sits for a year. Let’s see it in action.
| Metric | Product A: High-Margin Chandelier | Product B: Fast-Moving Pendant |
|---|---|---|
| Gross Margin | 55% | 40% |
| Inventory Turnover Rate | 1.5 | 4.0 |
| GMROI (Margin x Turnover) | 0.825 (Losing Money!) | 1.60 (Making Money!) |
Even though the chandelier has a higher margin, its slow turnover makes it a far worse investment for your business. The fast-moving pendant, despite its lower margin, is generating a much healthier return on your capital.
The “How Much” Question – A Practical Formula for Ideal Stock Levels
Okay, you understand the metrics. Now let’s answer the big question directly. How much stock of a specific product should you carry? The answer lies in a simple, practical formula.
Your Ideal Stock Level = Safety Stock + Lead Time Demand
Step 1: Calculating Your Safety Stock
Safety stock is your small, strategic buffer. It’s the “just in case” inventory that protects you from a sudden spike in customer demand or a minor shipping delay. It is not your primary inventory. For your proven bestsellers (the 20% that drive 80% of your sales), a good rule of thumb is to keep a safety stock that covers **2 to 4 weeks** of average sales.
Step 2: Calculating Your Lead Time Demand
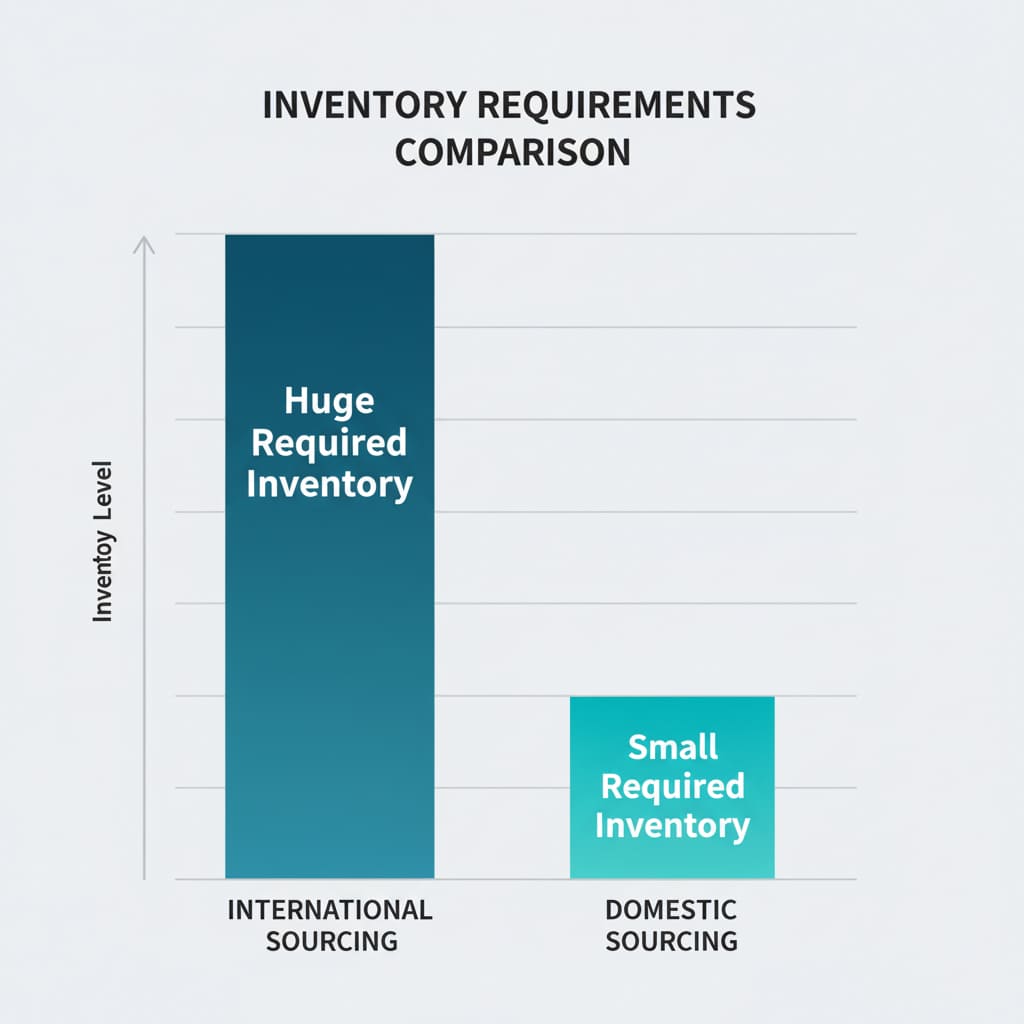
This is the most critical and most overlooked part of the equation. “Lead Time” is the time it takes from when you place an order with your supplier to when you receive it. “Lead Time Demand” is how many units you expect to sell during that waiting period. As you’re about to see, your supplier’s lead time has a massive, non-negotiable impact on the amount of inventory you are forced to carry.
| Factor | Supplier A: International Sourcing | Supplier B: Domestic Warehouse Sourcing |
|---|---|---|
| Average Sales | 10 units per week | 10 units per week |
| Safety Stock | 20 units (2 weeks of sales) | 20 units (2 weeks of sales) |
| Supplier Lead Time | 90 Days (12.8 weeks) | 7 Days (1 week) |
| Lead Time Demand (Sales x Lead Time) | 128 units | 10 units |
| Total Required Inventory (Safety + Lead Time) | 148 Units | 30 Units |
The math is undeniable. A long lead time forces you to carry **five times more inventory** to provide the exact same level of service to your customer. This is why a shorter lead time is your most powerful tool for running a leaner business. Learn more about how a US-based warehouse gives you this game-changing advantage.
SKU Count vs. Inventory Value – The Art of Smart Curation
Now we move to a more advanced question. It’s not just about how much of one item to carry, but how many *different* items (SKUs or “Stock Keeping Units”) to offer in your showroom.
The Danger of “SKU Bloat”: When More is Just More
It can be tempting to want to offer everything. But as research on “decision paralysis” has shown, offering too many choices can overwhelm customers and lead them to buy nothing at all. A cluttered showroom with too many options can feel confusing rather than abundant. It also spreads your inventory dollars too thin and makes it impossible to be “in stock” on your most important items.
The 80/20 Rule in Action: Finding Your “Hero” Products
The Pareto Principle is a powerful tool for curation. Take the time to analyze your own sales data. You will almost certainly find that a small number of your products—your “heroes”—are driving the vast majority of your sales. These are the products you must protect. You should always have your safety stock of these items on hand. The rest of your catalog is where you can be more experimental.
A Strategic Framework: The “Core, Test, and Rotate” Inventory Model
Think of your inventory like a well-balanced investment portfolio. This simple model provides a clear framework:
- 60% Core Inventory: This is your blue-chip stock. It’s your proven, year-round bestsellers. The “heroes.” This is where you focus the majority of your inventory dollars to ensure you are always in stock.
- 20% Test Inventory: This is your “venture capital.” Use a small part of your budget to bring in a handful of new, trendy, and exciting products in very small quantities. This is your trend laboratory. Not sure what to test? Start with what’s hot in kitchen lighting or leverage the latest TV design trends.
- 20% Rotational Inventory: This is your seasonal or secondary stock. It might be outdoor lighting that sells best in the spring and summer, or holiday-themed items. This keeps your showroom feeling fresh and relevant.
The #1 Factor Influencing Your Inventory Level: Your Supplier
You can have the best metrics and the smartest strategy in the world, but your ability to execute that strategy is almost entirely dependent on the capabilities of your supply partner.
High-MOQ Suppliers: Forcing You to Be a Warehouse
A supplier with a high Minimum Order Quantity (MOQ) fundamentally breaks the lean inventory model. They force you to overbuy. They force you to tie up your cash. They force you to take on massive risk. They are, in effect, forcing you to operate with a “stagnant pond” inventory model, whether you like it or not. If you’re stuck in this model, it’s time to learn how to break free.
The Low-MOQ / US-Warehouse Partner: Your Inventory Superpower
This is the solution. This is the enabler. A partner who offers a low, flexible MOQ and stocks their products in a US warehouse is the key to unlocking a modern, agile inventory strategy. They make the “Test and Reorder” model possible. They allow you to operate with a tiny safety stock. They give you the power to keep your inventory a flowing river. This is the single biggest advantage of a modern supply partnership. The difference is not small; it is everything. Compare the two models in our complete head-to-head guide.
From Inventory Anxiety to Inventory Agility
The answer to the question “how much inventory should I carry?” is not a static number. It is a dynamic system. The “right” amount is the absolute minimum you need to meet customer demand while operating with maximum financial agility. It’s about having your capital constantly working for you, not sitting idle on a shelf.
By shifting your mindset, tracking the right metrics, using a simple ordering formula, and—most importantly—choosing the right supply partner, you can transform your inventory from your biggest source of stress into your most powerful engine for growth. You can win this game.